This article is part of a series of articles I will be completing throughout the year, where I am going to analyze the average pace of the drivers and teams, in both qualifying and the races, to be able to gain a picture of performance levels.
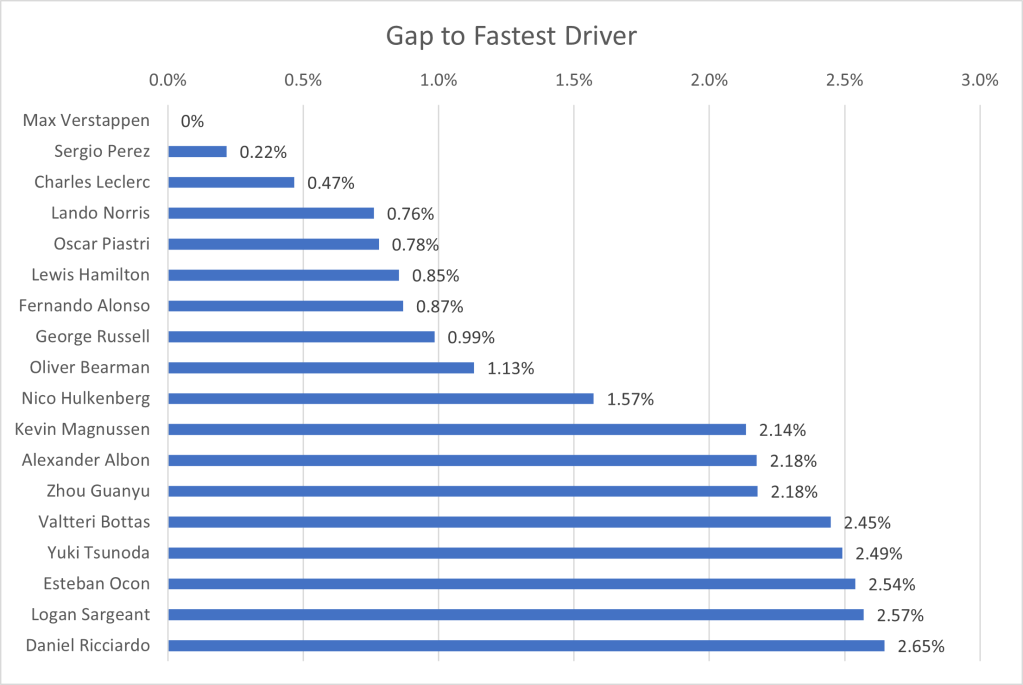
I have collated the fastest laps by each driver in qualifying, to show the average gap to the fastest driver. One caveat that arises, is that the top 10 drivers, through progressing to the final qualifying session, have a better track condition that those who only took part in Q1 or Q2. Due to this, the gap will be larger for the drivers outside the top ten than if qualifying was performed in one representative session. However, since the final session represents the point at which the top drivers are truly pushing, I’ve ruled it a better grounding point for the true limit of the cars, rather than only focusing on the first qualifying session in which the best times are not recorded.
Qualifying Pace-
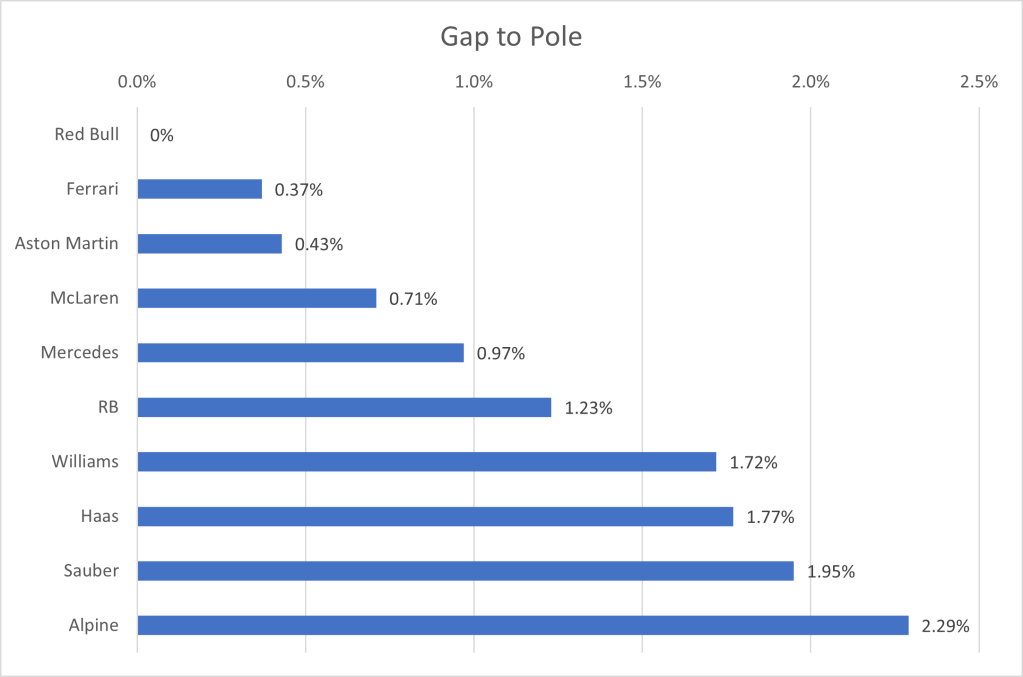
With no further ado, here are the gaps to pole:

And for the teams:

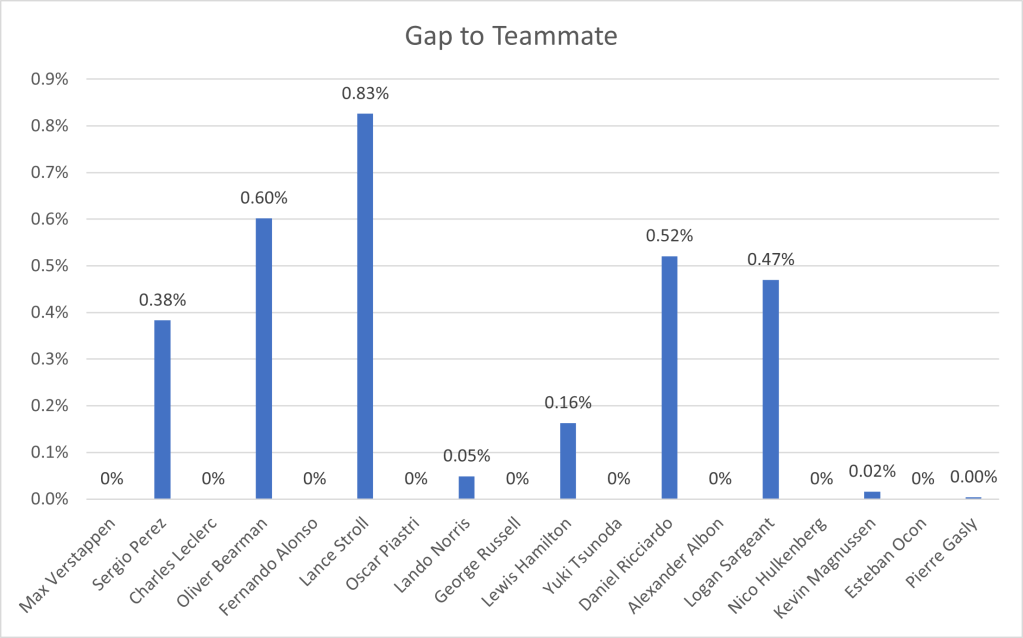
Additionally, I have collected the data for the gaps between teammates. I did this by using their fastest lap times set in the same session, so if one driver got into Q3, whilst the other only got into Q2, then I would count their Q2 times. Additionally, the lap times have to be representative, to avoid comparing out laps completed before a driver breaks down, as this would give us a very inaccurate representation of the drivers’ pace. Sauber have no comparison for Saudi, as Zhou did not set any times in qualifying:
Race Pace-
Next up in our data sets is the race pace of the drivers. I have calculated the average pace of the drivers, removing first laps, in-laps, out-laps, safety car laps and restarts after a safety car or red flag, as all these all not representative of a driver’s general pace. Additionally, if a driver has a spin, or another error that would greatly reduce their lap time, I have not counted these laps, as they would also not be representative of a drivers’ general pace.[1] I have only included drivers that completed at least 75% of the race distance (which for Saudi Arabia, excludes Lance Stroll and Pierre Gasly) so to not skew the season long averages against drivers that did not drive on low fuel with the best track conditions.
As different drivers have a varying number of race stints, this skews the overall pace. Generally, if a driver makes more stops, their pace will be faster on average. This will be taken into account in my final thoughts and analysis. Additionally, the average pace per stint and number of stints are recorded at the bottom of this article, for those interested in viewing more precise estimates of pace relative to other drivers on the same stint.[2]
And for the teams:
Analysis-
- There is a similar trend to in Bahrain, the Ferrari looks like it has slightly better degradation to the Red Bull. Leclerc’s hard tyre stint began with him setting times up to a second closer than the Red Bulls, but by the end of the stint, Leclerc was matching and beating the Red Bull’s times, even recording fastest lap on the final lap when Verstappen was also going for a fastest lap attempt.
- The McLaren appears to have some good pace behind it. Even though Piastri was stuck in Hamilton’s dirty air on used hard tyres for half the race, once he was out of dirty air, his lap times were around equal with Perez and only slightly behind Leclerc and Verstappen. Additionally, Norris posted the fastest stint of the race on his soft tyres, beating Hamilton’s pace. The McLaren has yet to prove to be a Red Bull challenger, but with an aggressive update schedule, it may still win some races this year.
- Norris and Hamilton both performed the fastest strategy for pace, but because others stopped under the safety car, they lost track position. They did however, have their pace slightly exaggerated in the averages. This makes the Mercedes look slightly better in the race pace averages, appearing to be the fourth fastest car. Comparing Alonso and Russell’s 2nd stints, it is clear that Alonso was slightly faster than the Mercedes.
- The bottom half of the field all had their averages skewed by Magnussen driving deliberately slowly, thus four teams have race pace averages of more than 2%, when no team achieved this in Bahrain.
Further Resources-
Qualifying Pace:
| Driver | Fastest Qualifying Time |
| Max Verstappen | 87.472 (0%) |
| Charles Leclerc | 87.791 (+0.365%) |
| Sergio Perez | 87.807 (+0.383%) |
| Fernando Alonso | 87.846 (+0.428%) |
| Oscar Piastri | 88.089 (+0.705%) |
| Lando Norris | 88.132 (+0.755%) |
| Lance Stroll | 88.25 (+0.889%) |
| George Russell | 88.316 (+0.965%) |
| Lewis Hamilton | 88.46 (+1.130%) |
| Yuki Tsunoda | 88.547 (+1.229%) |
| Oliver Bearman | 88.642 (+1.338%) |
| Alexander Albon | 88.98 (+1.724%) |
| Kevin Magnussen | 89.02 (+1.770%) |
| Daniel Ricciardo | 89.025 (+1.775%) |
| Nico Hulkenberg | 89.055 (+1.810%) |
| Valtteri Bottas | 89.179 (+1.951%) |
| Esteban Ocon | 89.475 (+2.290%) |
| Pierre Gasly | 89.479 (+2.294%) |
| Logan Sargeant | 89.526 (+2.348%) |
Average Race Pace:
| Driver | Pace |
| Max Verstappen | 92.883 (0%) |
| Sergio Perez | 93.085 (+0.217%) |
| Charles Leclerc | 93.317 (+0.467%) |
| Lando Norris | 93.59 (+0.761%) |
| Oscar Piastri | 93.607 (+0.779%) |
| Lewis Hamilton | 93.677 (+0.854%) |
| Fernando Alonso | 93.691 (+0.869%) |
| George Russell | 93.798 (+0.985%) |
| Oliver Bearman | 93.934 (+1.131%) |
| Nico Hulkenberg | 94.344 (+1.573%) |
| Kevin Magnussen | 94.866 (+2.135%) |
| Alexander Albon | 94.904 (+2.175%) |
| Zhou Guanyu | 94.907 (+2.178%) |
| Valtteri Bottas | 95.157 (+2.448%) |
| Yuki Tsunoda | 95.197 (+2.491%) |
| Esteban Ocon | 95.242 (+2.539%) |
| Logan Sargeant | 95.271 (+2.570%) |
| Daniel Ricciardo | 95.342 (+2.647%) |
All Stints:
| Best Stints | Pace |
| Norris 2nd (12L/US) | 92.28 |
| Hamilton 2nd (13L/US) | 92.333 |
| Verstappen 2nd (40L/NH) | 92.753 |
| Hulkenberg 2nd (16L/NH) | 92.776 |
| Zhou 2nd (7L/NS) | 92.818 |
| Perez 2nd (40L/NH) | 92.957 |
| Bottas 3rd (13L/NS) | 93.156 |
| Leclerc 2nd (40L/NH) | 93.167 |
| Piastri 2nd (40L/UH) | 93.483 |
| Alonso 2nd (40L/UH) | 93.555 |
| Russell 2nd (40L/NH) | 93.633 |
| Bearman 2nd (40L/NH) | 93.669 |
| Verstappen 1st (5L/NM) | 93.927 |
| Norris 1st (31L/NM) | 94.097 |
| Perez 1st (5L/NM) | 94.109 |
| Hamilton 1st (30L/NM) | 94.259 |
| Leclerc 1st (5L/NM) | 94.513 |
| Piastri 1st (5L/NM) | 94.603 |
| Magnussen 2nd (40L/NH) | 94.713 |
| Albon 2nd (40L/NH) | 94.75 |
| Alonso 1st (5L/UM) | 94.78 |
| Ocon 2nd (39L/NH) | 95.03 |
| Sargeant 2nd (39L/NH) | 95.068 |
| Tsunoda 2nd (39L/NH) | 95.099 |
| Russell 1st (5L/NM) | 95.122 |
| Ricciardo 2nd (38L/NH) | 95.186 |
| Hulkenberg 1st (27L/NM) | 95.273 |
| Zhou 1st (35L/NM) | 95.324 |
| Bottas 2nd (24L/NH) | 95.885 |
| Tsunoda 1st (5L/NM) | 95.964 |
| Bearman 1st (5L/NS) | 96.058 |
| Magnussen 1st (5L/NM) | 96.09 |
| Albon 1st (5L/NM) | 96.132 |
| Ricciardo 1st (5L/NM) | 96.524 |
| Sargeant 1st (5L/NM) | 96.848 |
| Bottas 1st (5L/NS) | 96.865 |
| Ocon 1st (5L/NM) | 96.893 |
Key: 1L= One Lap, 2L= Two Laps, NH= New Hards, UH= Used Hards, NM= New Mediums, NS= New Softs
Number of Stints:
| Number of Stints | Drivers |
| 2 | Verstappen, Perez, Leclerc, Piastri, Alonso, Russell, Bearman, Norris, Hamilton, Hulkenberg, Albon, Magnussen, Ocon, Sargeant, Tsunoda, Ricciardo, Zhou |
| 3 | Bottas |
[1] For example, I removed Daniel Ricciardo’s lap 48 for Saudi Arabia, as he spun and lost ten seconds.
[2] I only count a stint if a driver has completed five or more laps, to avoid short stints for fastest lap attempts skewing the data on the table.
