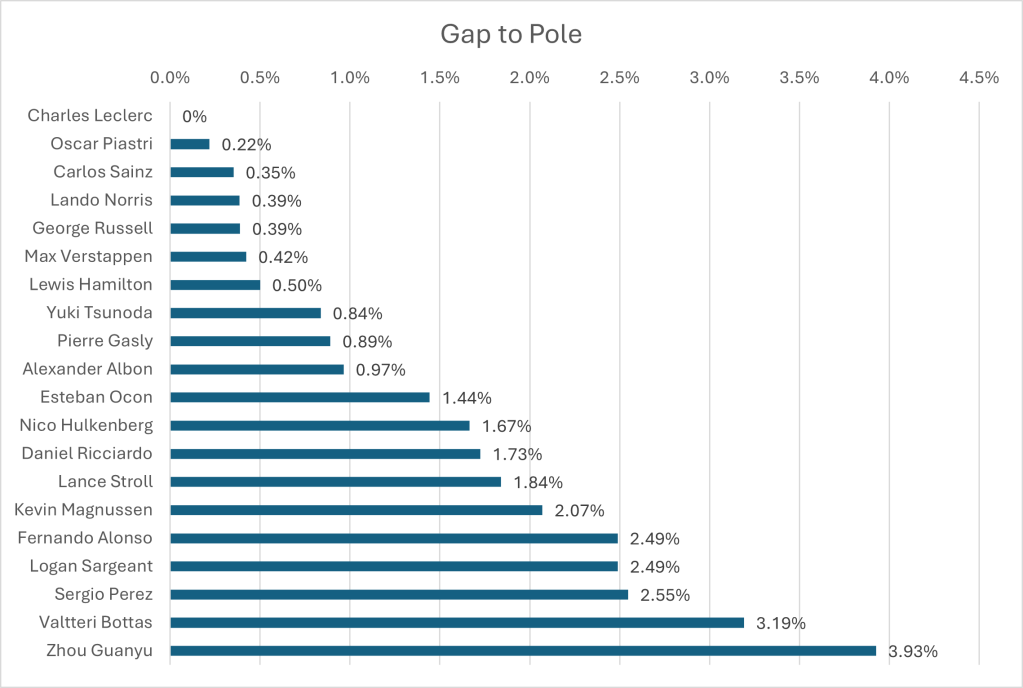
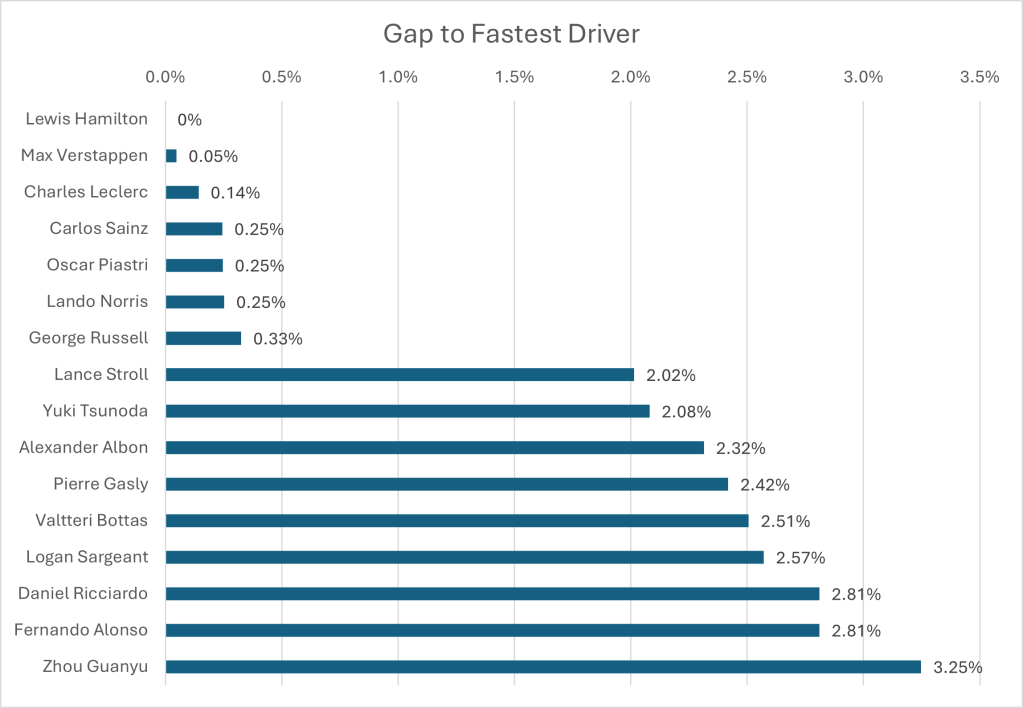
I have collated the fastest laps by each driver in qualifying, to show the average gap to the fastest driver. Whilst this extends the gap between drivers who made it to the top ten and those below, I’ve ruled using the overall fastest times a better grounding point for the true limit of the top cars, as the cars most likely to compete for points are my primary focus in these analyses.
Qualifying Pace-
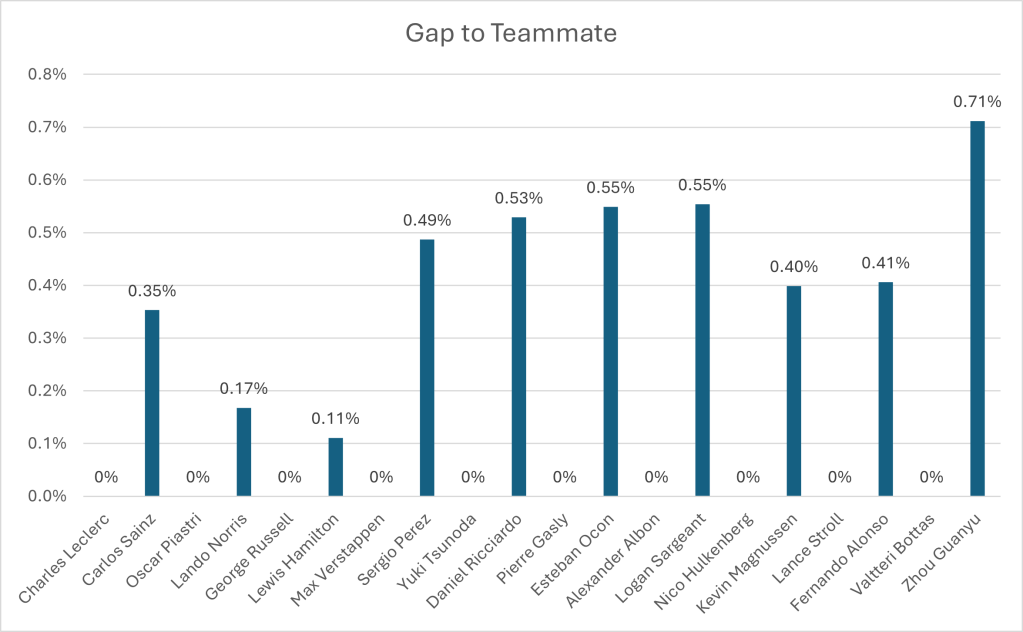
Additionally, I have collected the data for the gaps between teammates. I did this by using their lap times set in the same qualifying session. I generally compare the last session both drivers competed in, however if the fastest driver drove their fastest time in an earlier session, I count these times instead.
Race Pace-
I have calculated the average pace of the drivers, removing race starts, laps in the pit lane and extra formation laps as these are all too slow to be representative. I have only included drivers that completed at least 75% of the laps to not skew the season averages against drivers that never got the chance to run their cars on low fuel, which excludes Esteban Ocon, Sergio Perez and both Haas drivers in Monaco.
As different drivers have a varying number of race stints, this skews the overall pace. Generally, if a driver makes more stops, their pace will be faster on average. This will be considered in my final thoughts and analysis. Additionally, the average pace per stint and number of stints are recorded at the bottom of this article, for those interested in viewing more precise estimates of pace relative to other drivers on the same stint.[1]

Analysis:
- This race is not particularly representative of the pace of each team, as every driver was driving as slowly as possible for most of the race, to save their tyres on a track where overtaking is almost impossible.
- Consequently, the Haas team benefited in the season long average by being out of the race after the first lap. As there are only 22 races, this should have little effect on the season long average, but is worth noting.
- As they were the only drivers at the front to make a pit stop, Hamilton and Verstappen set the fastest average pace during the race. However, this does not represent the general pace the cars showed on similar stints, where the Ferrari and McLaren cars were faster.
- There were a number of laps where I could not tell if cars had strategically reduced their pace or were being lapped. As I could not tell, I did not remove these laps.
Further Resources-
Qualifying Pace:
| Driver | Fastest Qualifying Time |
| Charles Leclerc | 70.27 (0%) |
| Oscar Piastri | 70.424 (+0.219%) |
| Carlos Sainz | 70.518 (+0.353%) |
| Lando Norris | 70.542 (+0.387%) |
| George Russell | 70.543 (+0.389%) |
| Max Verstappen | 70.567 (+0.423%) |
| Lewis Hamilton | 70.621 (+0.500%) |
| Yuki Tsunoda | 70.858 (+0.837%) |
| Pierre Gasly | 70.896 (+0.891%) |
| Alexander Albon | 70.948 (+0.965%) |
| Esteban Ocon | 71.285 (+1.444%) |
| Nico Hulkenberg | 71.44 (+1.665%) |
| Daniel Ricciardo | 71.482 (+1.725%) |
| Lance Stroll | 71.563 (+1.840%) |
| Kevin Magnussen | 71.725 (+2.071%) |
| Fernando Alonso | 72.019 (+2.489%) |
| Logan Sargeant | 72.02 (+2.490%) |
| Sergio Perez | 72.06 (+2.547%) |
| Valtteri Bottas | 72.512 (+3.191%) |
| Zhou Guanyu | 73.028 (+3.925%) |
Average Race Pace:
| Driver | Pace |
| Lewis Hamilton | 78.245 (0%) |
| Max Verstappen | 78.283 (+0.048%) |
| Charles Leclerc | 78.357 (+0.143%) |
| Carlos Sainz | 78.437 (+0.245%) |
| Oscar Piastri | 78.438 (+0.247%) |
| Lando Norris | 78.443 (+0.253%) |
| George Russell | 78.5 (+0.326%) |
| Lance Stroll | 79.821 (+2.015%) |
| Yuki Tsunoda | 79.873 (+2.081%) |
| Alexander Albon | 80.056 (+2.315%) |
| Pierre Gasly | 80.138 (+2.419%) |
| Valtteri Bottas | 80.206 (+2.507%) |
| Logan Sargeant | 80.257 (+2.572%) |
| Daniel Ricciardo | 80.444 (+2.811%) |
| Fernando Alonso | 80.445 (+2.811%) |
| Zhou Guanyu | 80.786 (+3.248%) |
All Stints:
| Best Stints | Pace |
| Hamilton 3rd (26L/UH) | 75.673 |
| Verstappen 3rd (25L/UH) | 75.681 |
| Sargeant 3rd (18L/UH) | 77.127 |
| Zhou 3rd (5L/NS) | 77.636 |
| Leclerc 2nd (75L/NH) | 78.357 |
| Sainz 2nd (75L/NH) | 78.437 |
| Piastri 2nd (75L/UH) | 78.438 |
| Norris 2nd (75L/UH) | 78.443 |
| Stroll 4th (27L/NS) | 78.458 |
| Russell 2nd (75L/NM) | 78.5 |
| Verstappen 2nd (48L/NM) | 79.638 |
| Hamilton 2nd (47L/NM) | 79.668 |
| Bottas 3rd (60L/UH) | 79.84 |
| Tsunoda 2nd (74L/UH) | 79.873 |
| Albon 2nd (74L/NH) | 80.056 |
| Gasly 2nd (74L/NM) | 80.138 |
| Ricciardo 2nd (73L/UH) | 80.444 |
| Alonso 2nd (73L/UM) | 80.445 |
| Stroll 2nd (38L/UM) | 80.937 |
| Zhou 2nd (66L/NH) | 81.025 |
| Sargeant 2nd (53L/NM) | 81.32 |
| Bottas 2nd (11L/NM) | 82.206 |
Key: 1L= One Lap, 2L= Two Laps, NH= New Hards, UM= Used Mediums, NM= New Mediums, NS= New Softs
[1] I only include stints in the stint table if a driver has completed five or more representative laps, in an attempt to avoid fastest lap attempts. This has led to exclusions from the chart of everyone’s first stint and Stroll’s third stint.
