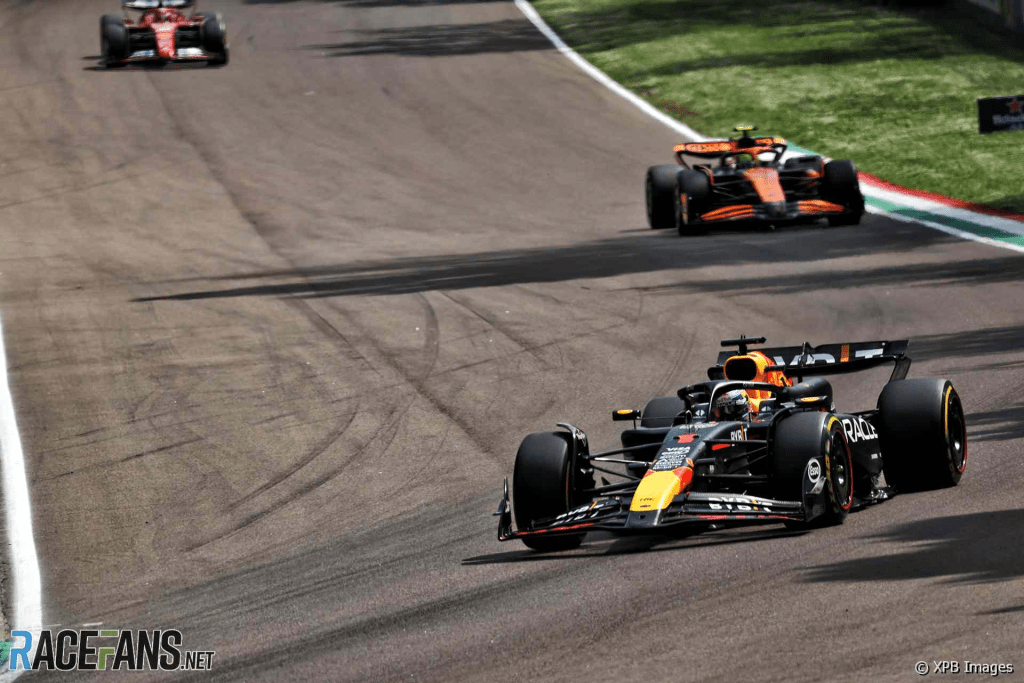
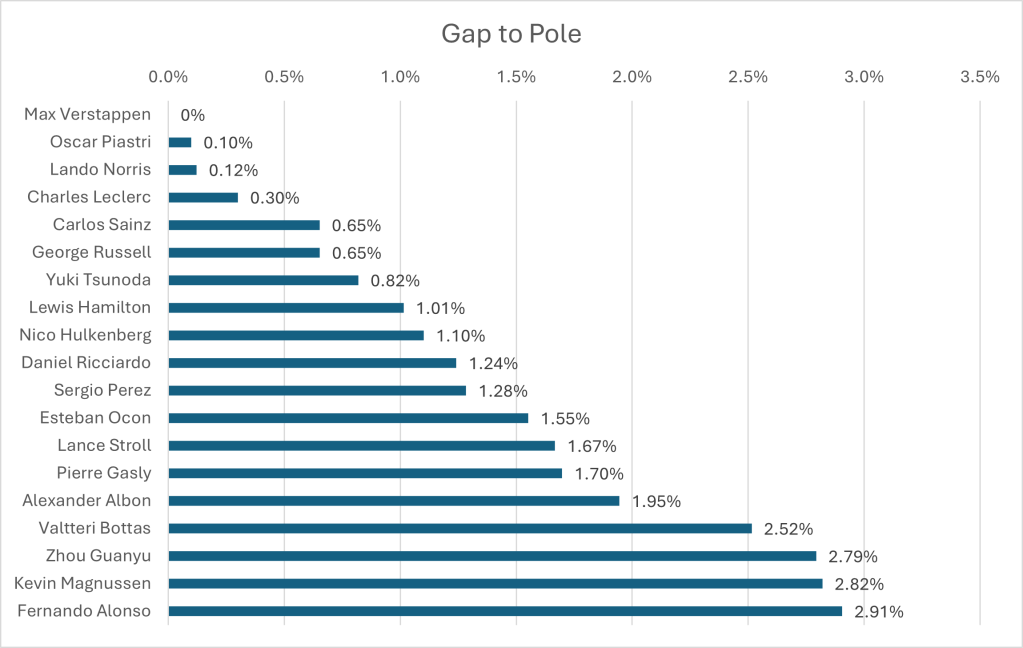
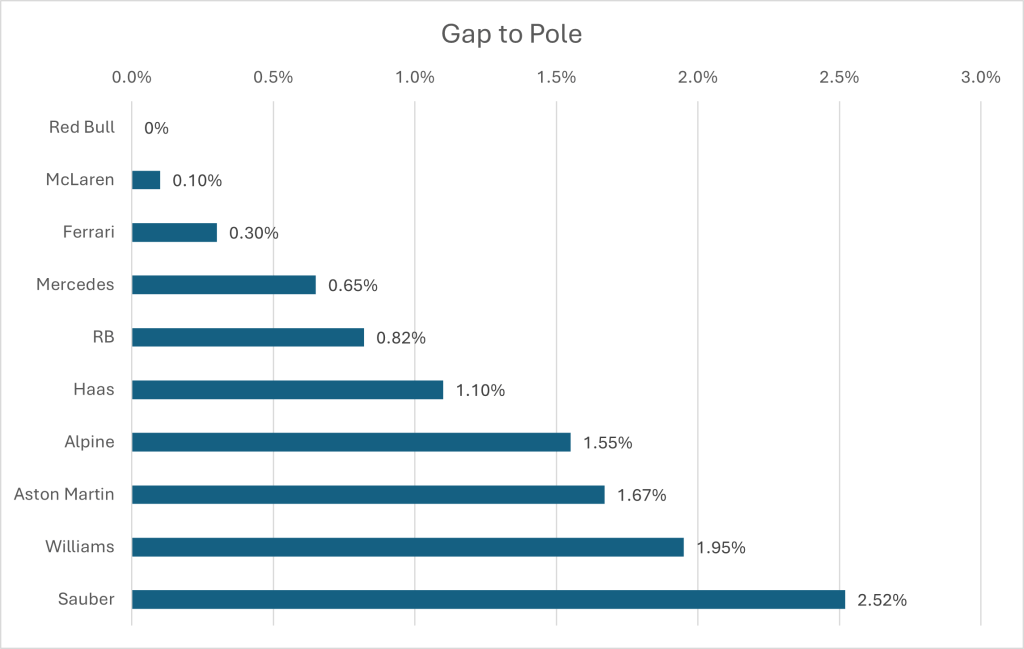
I have collated the fastest laps by each driver in qualifying, to show the average gap to the fastest driver. Whilst this extends the gap between drivers who made it to the top ten and those below, I’ve ruled using the overall fastest times a better grounding point for the true limit of the top cars, as the cars most likely to compete for points are my primary focus in these analyses.
Qualifying Pace-
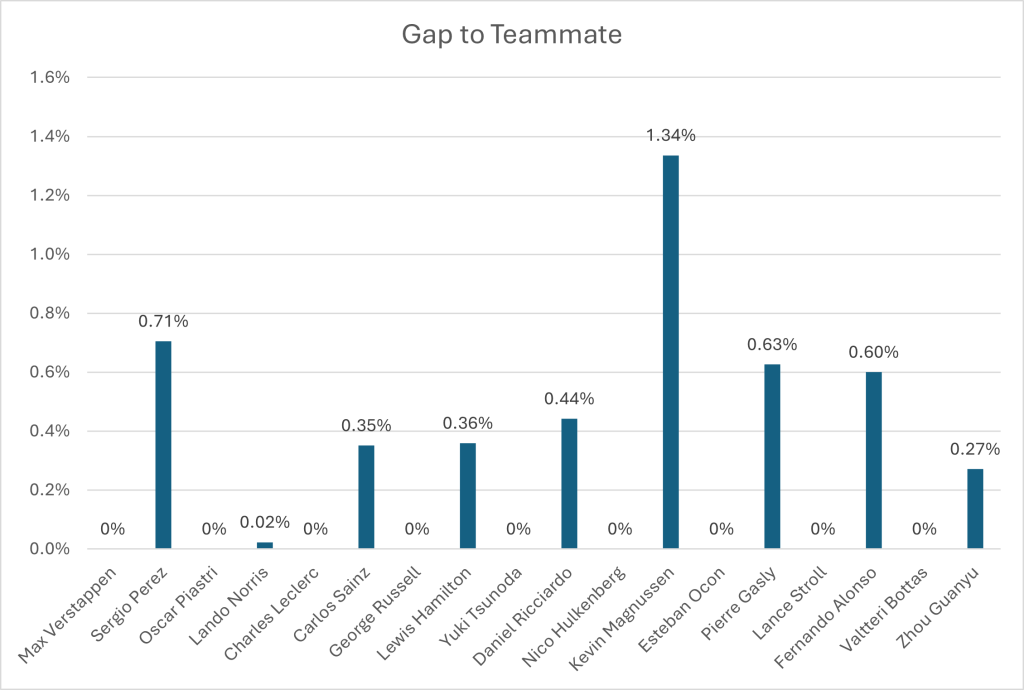
Additionally, I have collected the data for the gaps between teammates. I did this by using their lap times set in the same qualifying session. I generally compare the last session both drivers competed in, however if the fastest driver their fastest time in earlier sessions, I count these instead.
Race Pace-
I have calculated the average pace of the drivers, removing the first laps, laps in the pit lane and laps under the safety car as these are all too slow to be representative. Additionally, I removed any laps with major errors I noticed, such as when Perez or Hamilton crossed the gravel trap in Imola. I have only included drivers that completed at least 75% of the laps to not skew the season averages against drivers that never got the chance to run their cars on low fuel.
As different drivers have a varying number of race stints, this skews the overall pace. Generally, if a driver makes more stops, their pace will be faster on average. This will be considered in my final thoughts and analysis. Additionally, the average pace per stint and number of stints are recorded at the bottom of this article, for those interested in viewing more precise estimates of pace relative to other drivers on the same stint.[1]

Analysis:
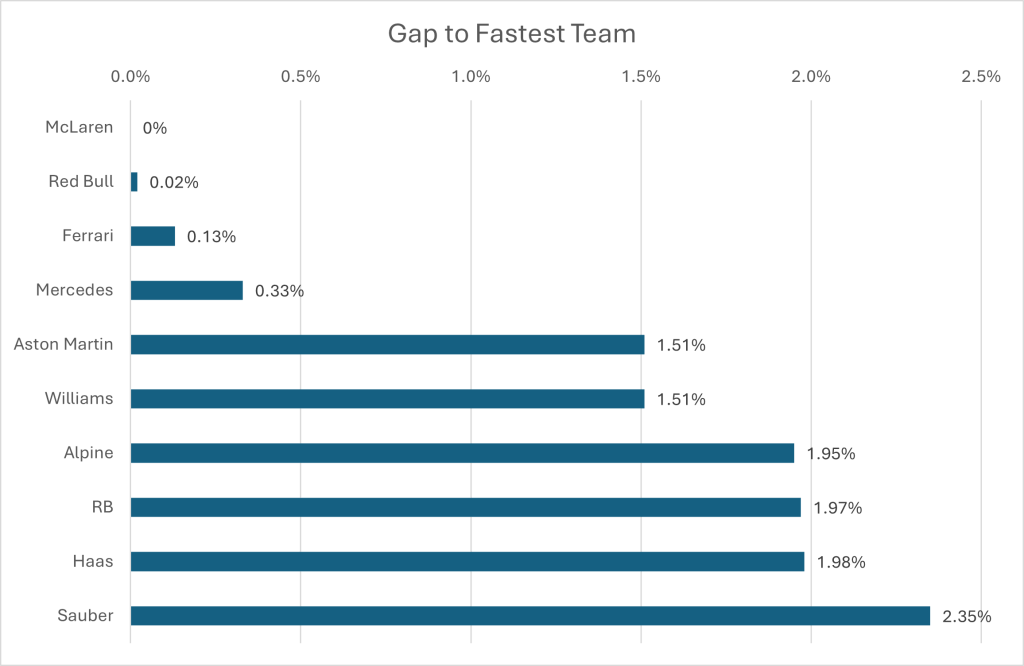
- Pace was generally quite similar between the top three drivers, who all were fastest at some point in the race. Whilst the track did not suit Ferrari, their upgrades appear to have put them in the fight with Red Bull, as well as McLaren’s upgrades nearly delivering another win to Lando Norris.
- Aston’s upgrades have not appeared to correlate very well and at present, their pace is similar to the lower midfield. This could be a very bad sign for their season, as upgrades not correlating was the cause of their downfall last season. If they don’t get a handle on their development, they may start to be regularly beaten by the likes of RB and Haas.
- Several teams ran terrible strategies, stopping their drivers onto hard tyres incredibly early, failing to account for high tyre degradation. These drivers tended to deliver slower second stints than their initial stints, a rarity in the post-refuelling era.
- Haas in particular, made a mistake when they reacted to Tsunoda’s early stop with Hulkenberg. If Hulkenberg had copied Magnussen’s strategy and stopped later he could have banked a ninth place, as he would have been able to overtake Tsunoda on newer tyres and would have covered off Stroll’s ability to overtake him. Magnussen finished less than two seconds behind Hulkenberg on this strategy, when he started in eighteenth.
- Albon’s pace seems to have been bolstered by his retirement, due to the suboptimal strategies of other drivers, as usually if a driver retires, their pace is relatively worse.
Further Resources-
Qualifying Pace:
| Driver | Fastest Qualifying Time |
| Max Verstappen | 74.746 (0%) |
| Oscar Piastri | 74.82 (+0.099%) |
| Lando Norris | 74.837 (+0.122%) |
| Charles Leclerc | 74.97 (+0.300%) |
| Carlos Sainz | 75.233 (+0.652%) |
| George Russell | 75.234 (+0.653%) |
| Yuki Tsunoda | 75.358 (+0.819%) |
| Lewis Hamilton | 75.504 (+1.014%) |
| Nico Hulkenberg | 75.569 (+1.101%) |
| Daniel Ricciardo | 75.674 (+1.242%) |
| Sergio Perez | 75.706 (+1.284%) |
| Esteban Ocon | 75.906 (+1.552%) |
| Lance Stroll | 75.992 (+1.667%) |
| Pierre Gasly | 76.015 (+1.698%) |
| Alexander Albon | 76.2 (+1.945%) |
| Valtteri Bottas | 76.626 (+2.515%) |
| Zhou Guanyu | 76.834 (+2.793%) |
| Kevin Magnussen | 76.854 (+2.820%) |
| Fernando Alonso | 76.917 (+2.905%) |
Average Race Pace:
| Driver | Pace |
| Lando Norris | 80.857 (0%) |
| Max Verstappen | 80.876 (+0.024%) |
| Charles Leclerc | 80.959 (+0.127%) |
| Oscar Piastri | 81.07 (+0.263%) |
| George Russell | 81.121 (+0.326%) |
| Carlos Sainz | 81.199 (+0.423%) |
| Lewis Hamilton | 81.31 (+0.560%) |
| Sergio Perez | 81.578 (+0.891%) |
| Lance Stroll | 82.078 (+1.510%) |
| Alexander Albon | 82.078 (+1.510%) |
| Fernando Alonso | 82.289 (+1.771%) |
| Pierre Gasly | 82.434 (+1.950%) |
| Yuki Tsunoda | 82.449 (+1.969%) |
| Kevin Magnussen | 82.46 (+1.982%) |
| Nico Hulkenberg | 82.55 (+2.094%) |
| Daniel Ricciardo | 82.571 (+2.120%) |
| Zhou Guanyu | 82.759 (+2.353%) |
| Logan Sargeant | 82.81 (+2.416%) |
| Esteban Ocon | 82.81 (+2.416%) |
| Valtteri Bottas | 82.987 (+2.634%) |
All Stints:
| Best Stints | Pace |
| Russell 3rd (10L/UM) | 79.934 |
| Perez 2nd (25L/NM) | 80.49 |
| Norris 2nd (40L/UH) | 80.612 |
| Leclerc 2nd (37L/NH) | 80.659 |
| Verstappen 2nd (38L/NH) | 80.723 |
| Piastri 2nd (39L/UH) | 80.779 |
| Sainz 2nd (35L/NH) | 80.91 |
| Hamilton 2nd (35L/NH) | 80.992 |
| Verstappen 1st (22L/NM) | 81.14 |
| Russell 2nd (28L/NH) | 81.156 |
| Stroll 2nd (25L/UH) | 81.276 |
| Norris 1st (20L/NM) | 81.348 |
| Leclerc 1st (23L/NM) | 81.412 |
| Alonso 3rd (17L/UM) | 81.492 |
| Sainz 1st (25L/NM) | 81.604 |
| Piastri 1st (21L/NM) | 81.609 |
| Russell 1st (19L/NM) | 81.692 |
| Magnussen 2nd (24L/NH) | 81.727 |
| Hamilton 1st (24L/NM) | 81.774 |
| Albon 5th (21L/UM) | 81.788 |
| Albon 3rd (12L/NH) | 82.007 |
| Hulkenberg 1st (11L/NM) | 82.256 |
| Tsunoda 1st (10L/NM) | 82.259 |
| Gasly 2nd (20L/NH) | 82.331 |
| Sargeant 2nd (30L/NM) | 82.35 |
| Perez 1st (34L/NH) | 82.378 |
| Ricciardo 1st (9L/NM) | 82.386 |
| Zhou 2nd (28L/NM) | 82.415 |
| Gasly 3rd (31L/NM) | 82.455 |
| Tsunoda 2nd (49L/NH) | 82.488 |
| Ricciardo 2nd (50L/NH) | 82.604 |
| Albon 1st (8L/NM) | 82.612 |
| Hulkenberg 2nd (48L/NH) | 82.617 |
| Alonso 2nd (31L/UH) | 82.626 |
| Stroll 1st (35L/UM) | 82.651 |
| Gasly 1st (6L/NS) | 82.666 |
| Ocon 2nd (36L/NH) | 82.745 |
| Bottas 1st (6L/NM) | 82.825 |
| Ocon 1st (23L/NM) | 82.912 |
| Magnussen 1st (35L/NM) | 82.962 |
| Bottas 2nd (53L/NH) | 83.005 |
| Zhou 1st (31L/NH) | 83.071 |
| Alonso 1st (5L/NS) | 83.145 |
| Sargeant 1st (29L/NH) | 83.286 |
Key: 1L= One Lap, 2L= Two Laps, NH= New Hards, UM= Used Mediums, NM= New Mediums, NS= New Softs
[1] I only include stints in the stint table if a driver has completed five or more representative laps, in an attempt to avoid fastest lap attempts. This has led to exclusions from the chart of Alonso’s fourth stint and Albon’s second and fourth stints.